FLAGSHIP RESEARCH · SYSTEMATIC EQUITIES
Cross-Sectional Momentum Pullback
A long-only equity strategy research program combining cross-sectional momentum selection, controlled short-term pullbacks, portfolio simulation, and rigorous research checks.
The research hypothesis
A momentum leader may offer a less extended entry after a bounded pullback while the longer-term trend remains intact. The central question is whether a disciplined selection and resumption process improves the opportunity-versus-risk tradeoff after realistic portfolio accounting and execution assumptions.
Architecture and methods
- Historical security data are normalized and subjected to exchange, price, liquidity, identity and history checks.
- Multi-horizon relative-strength and trend features feed a monthly cross-sectional leadership screen.
- Entry research looks for pullback magnitude, stabilization and positive price resumption instead of indiscriminately buying weakness.
- Portfolio rules constrain position size, sector weight, exposure, holding period and exit decisions.
- Production-readiness modules test data integrity, benchmark preparation, state reconciliation and forward-market-data inputs.
The public GitHub repository includes curated Python data, screener and backtest code, stochastic research modules, configuration examples, synthetic tests and two saved charts. Private operational state and raw market datasets are excluded.
Original research charts and backtest snapshot
The following figures are outputs from the public research repository, not illustrations made to resemble trading results. The saved January 2, 2019–August 31, 2026 run reports a preliminary, unaudited simulation:
| Measure | Saved simulation |
|---|---|
| Cumulative return | +173.25% |
| Annualized return | 14.02% |
| Maximum drawdown | -7.88% |
| Annualized volatility | 10.30% |
| Completed trades | 343 |
| Average gross exposure | 9.53% |
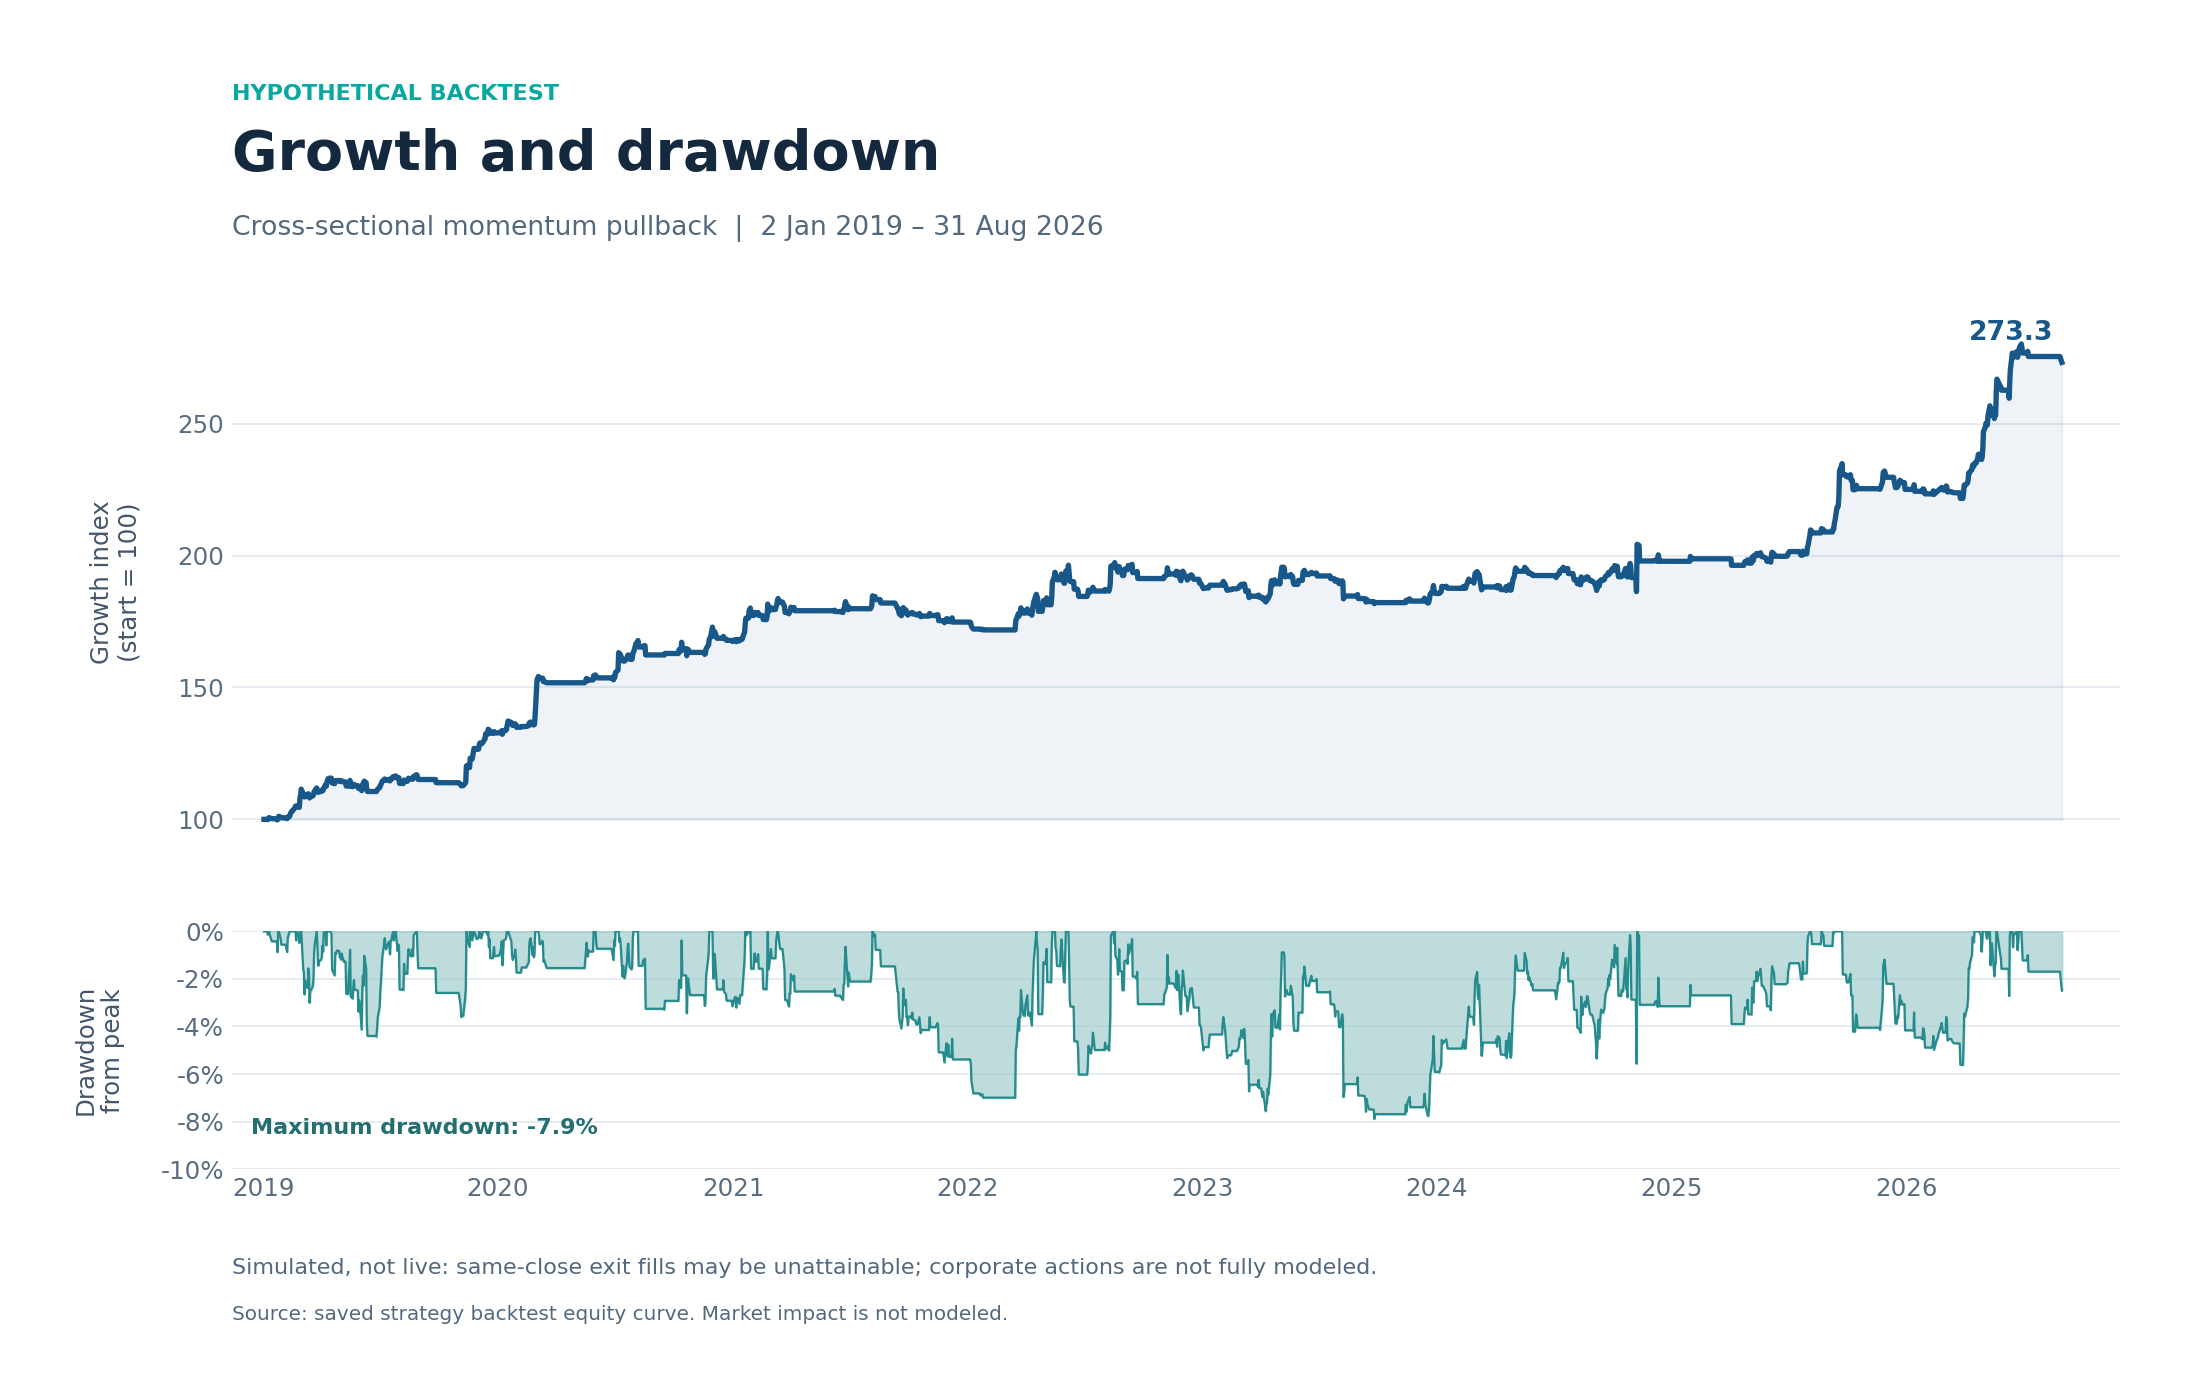
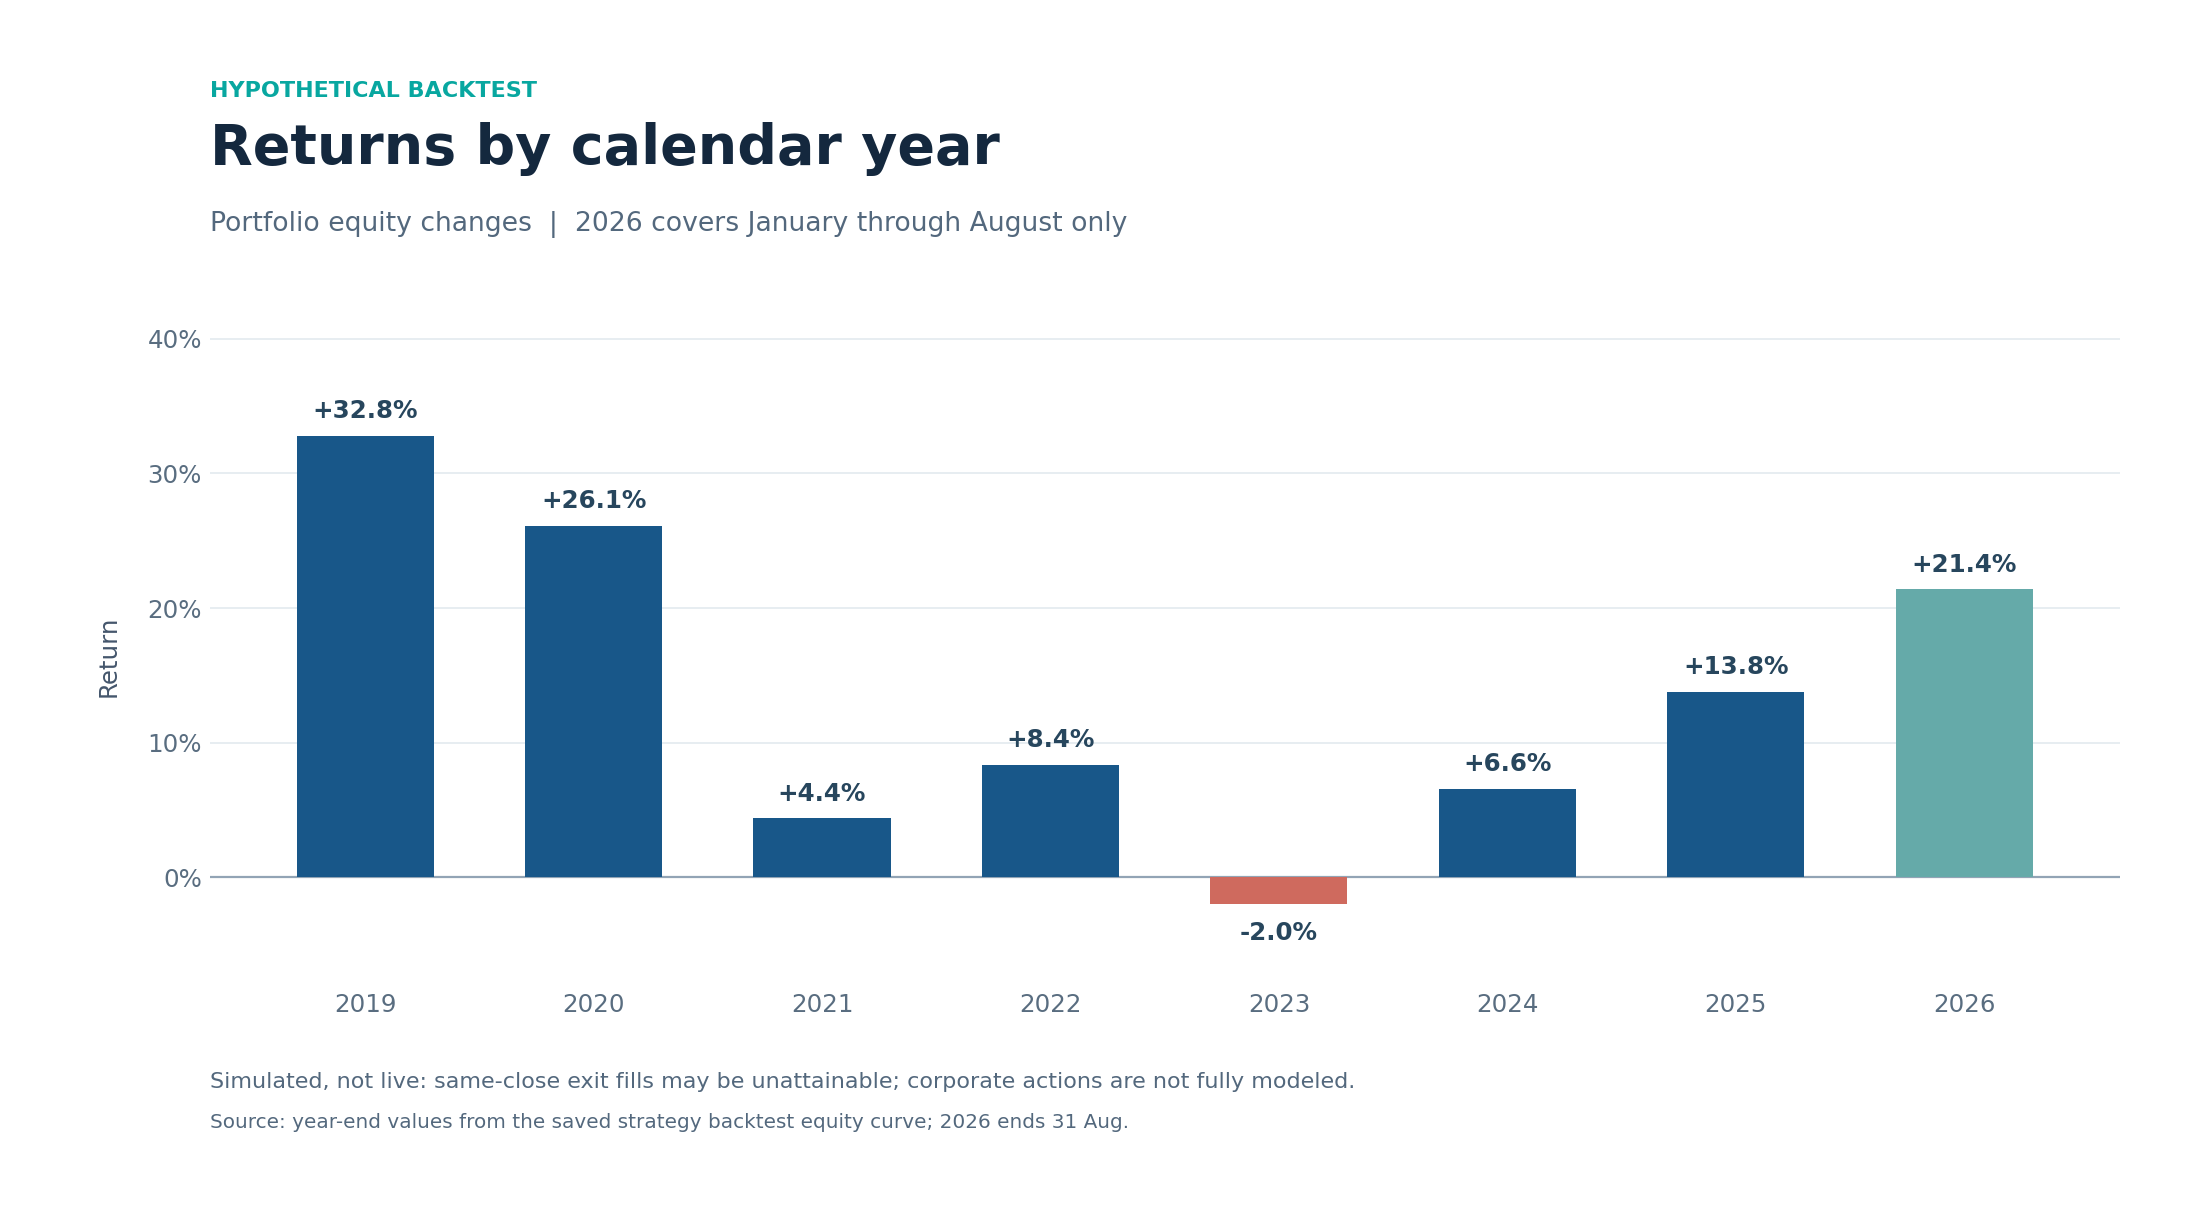
Optimization and validation considerations
My broader development process included a six-factor full-factorial research experiment with 729 parameter combinations. Such a grid helps expose parameter sensitivity, but selecting a strong historical configuration after examining many combinations also creates overfitting risk.
- The published saved simulation assumes some same-close exit fills after using the closing price to determine exits; those fills may be unachievable in practice.
- Dividends and stock splits are not fully reconciled in the historical engine; mixed adjustment conventions can materially affect simulated returns.
- The strategy configuration was frozen after the illustrated period; the displayed results should not be called an independent out-of-sample test.
- Cash was idle on a substantial portion of the observed calendar; a real account may accrue interest or incur other costs not modeled.
- A saved Sharpe statistic has a documented reconciliation discrepancy; therefore this case study does not cite a Sharpe ratio.
- The public research README intentionally omits formal benchmark comparison because return and adjustment conventions could not be aligned independently.
- Unit and synthetic tests help verify components under defined inputs, but do not prove investable real-world results.
What this project taught me
Momentum can help answer which securities deserve attention; a pullback can help ask when an entry is worth considering. The difficult work is preventing data errors and optimistic execution assumptions from turning that intuitive idea into misleading statistics. I place more weight on reproducibility, validation and understanding failures than on a single equity-curve result.
Explore original evidence
- GitHub overview and disclosures
- Public data, screen and backtest code
- Synthetic tests
- Stochastic research module
Personal research only. Performance is simulated and unaudited; it is neither investment advice nor a representation of live results.
